Contents
The Gap Between ESG Reporting And Operational Reality
Why Emissions Data Rarely Becomes Decision-Grade (And What Leaders Need Instead)
Where Power BI Helps… And Where It Doesn’t
Turning Emissions Data Into Actionable Insights
Clean Energy ESG Use Cases That Work In Practice
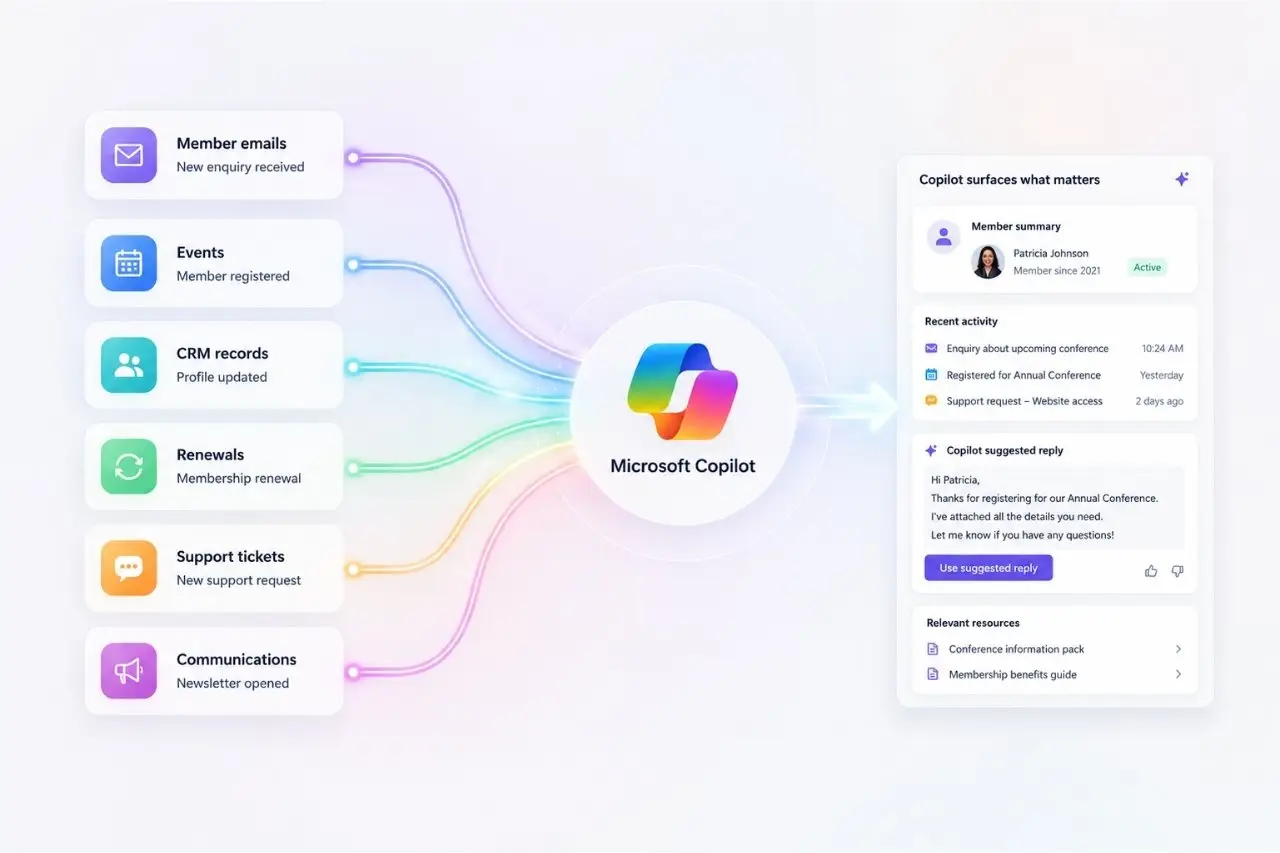
How Membership Organisations Are Using AI Agents Like Microsoft Copilot To Support Members

Shadow AI Is A Bigger Risk Than Shadow IT Ever Was
Clean energy teams invest heavily in emissions reporting, but much of that effort still sits outside day-to-day decision-making.
The reporting is almost always detailed, well intentioned and carefully maintained. Yet for many leadership teams, that data still doesn’t influence everyday decisions as much as it should.
So the question we have to ask is… why?
ESG reporting exists to satisfy external expectations.
Regulators, investors, funders and partners all need that visibility. The problem is that that style of reporting usually looks backwards. By the time emissions figures reach the board, the opportunity to act has already passed. And this is where gaps start to appear.
Teams track emissions, but they’re not always sure if they can trust the data. The board see totals, but not what’s driving change. Operations teams know where the pressure points are but can’t always connect their actions to reported outcomes.
Used well, Power BI won’t replace ESG strategies or fix poor data.
What it can do though is bring emissions information together, make it consistent and present it at the right level for different decision-makers.
When that happens, emissions data stops being something organisations explain after the fact, and starts becoming something they can actually use and plan with.
As I’ve said, clean energy organisations aren’t short of emissions data. What many often lack though is alignment between how that data is reported and how decisions are actually made.
In many cases, emissions reporting will have evolved separately from operational delivery. Sustainability teams focus on accuracy and compliance. Operations teams focus on performance and reliability. Leadership teams need clarity and confidence.
When those needs don’t get joined up, reporting starts to drift away from reality on the ground.
That drift is where gaps appear.
Emissions reporting is frequently treated as a periodic exercise.
Data is gathered, validated, reconciled and approved before it’s shared. Each step is sensible on its own, but together they introduce delay.
By the time emissions figures reach senior leaders, they reflect a moment that’s already passed. Operational teams may have responded to issues weeks earlier, but the reporting doesn’t show that story yet. Leaders are left reviewing outcomes without the context of what changed, when, or why.
When insight arrives late, it loses its ability to influence action.
Much of today’s ESG reporting is shaped by external requirements.
Regulations, audits, and funding expectations all prioritise consistency and traceability. That focus is necessary, but it also pushes reporting towards static outputs.
Metrics are locked to reporting periods. Views are designed for disclosure, not exploration. Questions tend to be answered after numbers are finalised rather than whilst trends are emerging. The result is reporting that explains what happened but offers little help in deciding what to do next.
Over time, this creates a culture of explanation rather than improvement.
The symptoms are easy to recognise.
Boards see headline emissions figures but struggle to understand what’s driving change. Sustainability teams spend more time validating data than exploring it. Operations teams know where the pressure points are but can’t always connect their actions to the numbers being reported upwards.
None of this points to a lack of capability or intent.
It reflects reporting models that were never designed to support fast, operational decision-making. Until emissions data can keep pace with reality, it will continue to sit just outside the decisions it’s meant to inform.
For emissions data to be decision-grade, it has to do more than exist.
Leaders need to trust it, understand it, and see how it connects to the choices in front of them. That’s where many organisations struggle.
The issue isn’t a lack of effort or intent. It’s that emissions data is often produced to satisfy reporting needs, not to support real-time decision-making. When that happens, even accurate data can fail to influence behaviour.
Understanding why that gap exists helps clarify what leaders actually need instead.
Most emissions data is gathered with a clear destination in mind: reports, disclosures and audits. The structure of the data reflects that purpose. It’s organised by reporting period, scope, and compliance framework rather than by the operational questions leaders are trying to answer.
This creates a subtle but important limitation. Data can confirm whether targets were met, but it struggles to explain what changed or what should change next. Leaders receive answers to past questions, not insight into current choices.
Decision-grade data starts with the decisions themselves, not the report they eventually feed.
Emissions data rarely lives in one place.
It’s pulled from operational systems, supplier information, spreadsheets, finance platforms, and sustainability tools. Each source may be valid on its own, but together they create complexity.
Every manual step adds friction. Reconciliation takes time. Assumptions creep in. Small inconsistencies multiply. By the time a consolidated view is produced, confidence in the underlying data is often diluted.
When leaders aren’t fully confident in how numbers were derived, hesitation replaces action.
Even where data is available and consolidated, definitions don’t always align. Boundaries shift. Intensity metrics are interpreted differently. Methodologies evolve between reporting cycles.
From a board perspective, this creates uncertainty. A change in emissions might signal operational improvement, or it might reflect a change in calculation. Without clarity, leaders are left questioning the data rather than using it.
Decision-grade insight depends on shared understanding as much as shared data.
Clean energy operations don’t move in neat reporting cycles. Asset performance changes daily. External conditions shift. Decisions are made continuously. Yet emissions reporting often lags behind this reality.
When insight arrives weeks or months after events occur, it becomes explanatory rather than useful. Teams may already have acted, but leadership can’t see the impact of those actions yet.
For data to influence decisions, it needs to move closer to the pace of the organisation.
Leaders don’t need more emissions data. They need clearer insight. That means visibility into trends, drivers, and trade-offs, not just totals and targets.
They need confidence that numbers reflect reality. They need to understand why emissions are changing, where influence exists, and what options are available. Most importantly, they need insight early enough to act on it.
When emissions data meets those needs, it stops being a reporting obligation and starts becoming a decision-making asset.
Power BI is often positioned as a solution in its own right.
In practice, it’s better thought of as an enabler. Used well, it helps organisations see what’s already there more clearly. Used badly, it simply visualises existing problems.
Understanding where Power BI adds real value, and where its limits sit, is essential if emissions reporting is going to move beyond presentation and into decision support.
One of Power BI’s strengths is its ability to sit across existing systems rather than replace them. For clean energy organisations with complex estates, that matters. Emissions data can be pulled from operational platforms, finance systems, supplier data, and sustainability tools without forcing everything into a single new solution.
That aggregation creates a shared view of emissions that didn’t previously exist. Leaders can see information in one place rather than relying on stitched-together reports. Teams spend less time exporting and reconciling data, and more time understanding it.
Power BI doesn’t simplify the estate, but it can simplify how the estate is seen.
Different teams need different views of emissions data. Boards care about trends and risk. Sustainability teams care about accuracy and scope. Operations teams care about performance and drivers.
Power BI allows those views to coexist without fragmenting the data underneath. A single model can support multiple perspectives, each tailored to the decisions being made at that level. When teams are working from the same underlying numbers, conversations become more constructive.
Alignment doesn’t come from identical dashboards. It comes from shared foundations.
Static reports tend to flatten insight. Power BI makes it easier to explore change over time, compare assets or sites, and highlight where emissions intensity is shifting rather than just where totals sit.
This matters because decisions rarely hinge on a single number. They hinge on understanding patterns. What’s improving, what’s deteriorating, and where intervention will have the greatest impact.
When leaders can see drivers alongside outcomes, emissions data becomes easier to act on.
Power BI doesn’t resolve poor data quality. It doesn’t define ownership. It doesn’t align methodologies. If emissions data is inconsistent or incomplete, dashboards will reflect that reality very clearly.
This is often where expectations need resetting. Visualisation can expose issues, but it can’t correct them on its own. Governance, definitions, and data discipline still matter. Without them, even the most polished reports will struggle to build confidence.
Power BI amplifies what exists. It doesn’t replace the work needed to make emissions data trustworthy.
When Power BI is positioned as part of a wider ESG and data strategy, it becomes far more effective. It supports conversation rather than replacing it. It highlights where questions need answering rather than pretending to have all the answers.
In that role, it helps organisations move from explaining emissions after the fact to understanding them in time to influence outcomes. That shift is subtle, but it’s where reporting starts to support better decisions.
Actionable insight doesn’t come from more charts or more metrics. It comes from helping people understand what’s changing, why it’s changing, and what they can realistically influence next. That’s the shift clean energy organisations are aiming for when they invest in better reporting.
When emissions data is structured around those questions, it starts to support decisions rather than just describe outcomes.
Emissions figures become meaningful when they’re connected to what’s actually happening across the organisation. Energy output, asset utilisation, maintenance activity, and supplier changes all influence emissions, but those relationships are often hidden in separate systems.
By linking emissions data to operational context, leaders can see cause and effect more clearly. A change in intensity starts to make sense when it’s viewed alongside production levels or asset performance. That connection turns emissions from an abstract number into something teams can influence.
Insight emerges when data reflects how the organisation really operates.
High-level averages can be misleading. They smooth out variation and hide the areas where action would have the greatest impact. For decision-makers, that can lead to effort being spread too thinly or focused in the wrong place.
Actionable insight highlights exceptions. It shows where emissions are disproportionately high, where performance is drifting, or where small changes could deliver meaningful improvement. That allows teams to focus attention where it matters most.
Hotspots prompt decisions. Averages often delay them.
Total emissions figures are important for reporting, but they don’t always tell the full story. In growing or changing organisations, totals can rise even when performance is improving. Without context, that can create confusion at leadership level.
Intensity metrics help bridge that gap. They show emissions relative to output, activity, or scale. When leaders can see both totals and intensity together, conversations become more balanced and more informed.
That balance is critical for making decisions that support both growth and sustainability goals.
One of the biggest shifts occurs when teams can see the impact of decisions sooner rather than later. Whether it’s a change in asset configuration, supplier behaviour, or operational process, early visibility helps organisations adjust course quickly.
Actionable insight isn’t about perfect prediction. It’s about reducing the time between action and understanding. When that gap shrinks, emissions data becomes part of an ongoing feedback loop rather than a retrospective explanation.
That’s when reporting starts to shape behaviour, not just record it.
Actionable insight only matters if it holds up in day-to-day operations. In clean energy environments, the most effective ESG reporting use cases tend to be the ones that remove friction rather than add complexity.
These aren’t edge cases or future-state ambitions. They’re the kinds of scenarios organisations are already dealing with, made clearer through better visibility.
At portfolio level, leaders need to understand how emissions performance varies across sites, assets, or projects. Not just where totals sit today, but how trends are evolving over time.
Clear portfolio views help boards assess risk, prioritise investment, and understand where capital is likely to deliver the greatest impact. They also support more confident conversations with investors and funders, grounded in evidence rather than narrative.
The value isn’t in seeing every detail. It’s in seeing enough to make informed choices.
Operational teams often know which sites or assets are underperforming, but that knowledge doesn’t always travel upwards. When emissions data is presented consistently across locations, comparisons become easier and more constructive.
Leaders can see where performance is drifting, where improvements are holding, and where intervention is needed. That visibility helps focus effort rather than spreading it evenly across the estate.
Comparison, when done well, creates clarity rather than competition.
Scope 3 emissions are notoriously difficult to manage. Data arrives from multiple suppliers, in different formats, and at different levels of maturity. Many organisations rely heavily on spreadsheets to bridge the gaps.
Practical reporting focuses on progress rather than perfection. Bringing supplier data together in a consistent way helps teams identify material contributors, track improvement over time, and prioritise engagement where it matters most.
The goal isn’t total certainty. It’s usable visibility.
One of the most common pain points is the effort required to prepare board packs. Data is extracted, reformatted, checked, and rechecked each reporting cycle. That process is slow and fragile.
When emissions reporting is structured properly, board-level views can be refreshed rather than rebuilt. Leaders get consistent information, teams reduce manual effort, and conversations focus on insight rather than reconciliation.
That shift saves time, but more importantly, it changes how ESG reporting is perceived at the top of the organisation.
For ESG reporting to influence decisions at board level, it has to fit the way boards actually work. Time is limited. Context matters. Confidence in the numbers is assumed, not debated. When reporting doesn’t meet those expectations, it risks becoming a background activity rather than a strategic input.
Useful board reporting isn’t about detail. It’s about clarity, relevance, and trust.
Boards are rarely looking for exhaustive data. They want to understand direction, risk, and exposure. Are emissions moving in the right direction? Where are the material issues? What could derail progress?
Clear trends, supported by concise explanation, are far more valuable than dense tables or overly technical visuals. When boards can quickly grasp what’s changed and why, they can focus on the decisions that matter.
Good reporting answers questions before they’re asked.
Emissions data is complex by nature. Oversimplifying it can be just as risky as overwhelming decision-makers with detail. The challenge is to surface complexity only when it’s relevant.
At board level, this often means starting with a clear summary view, with the ability to explore drivers when required. Leaders don’t need to see every assumption upfront, but they do need confidence that the detail exists and is accessible.
That balance builds trust without slowing discussion.
Visual polish can be misleading. Dashboards that look sophisticated don’t always support better decisions. Too many metrics, poorly explained changes, or unclear ownership can all reduce usefulness.
Effective board reporting is intentional. Every metric has a purpose. Every visual answers a specific question. When reporting is designed this way, it becomes a tool for conversation rather than a set of slides to be reviewed and filed away.
Clarity beats complexity every time.
Clean energy organisations don’t struggle because they lack emissions data. They struggle because too much of that data arrives too late, in the wrong shape, or without enough context to support confident decisions.
When ESG reporting is designed purely for disclosure, it naturally looks backwards. It explains what happened, but rarely helps leaders influence what happens next. That gap isn’t about tools or intent. It’s about how information is structured, shared, and trusted across the organisation.
Used in the right way, Power BI can help close that gap. Not by fixing ESG strategy or correcting poor data, but by bringing emissions information together, making it consistent, and presenting it at a level that supports real conversations. When leaders can see trends, understand drivers, and explore impact early, emissions data becomes part of decision-making rather than an afterthought.
The shift isn’t dramatic, but it is meaningful. Emissions data stops being something organisations explain after the fact, and starts becoming something they can actually use.
Ready For More?